The Tinderbox of Debt and Deficits
Japan – Land of the Setting Sun
The Reuters’13 article on August 27, 2013 stated:
Japan’s debt-funding costs to hit $257 billion next year
Japan expects to spend a record $257 billion to service its debt during the next fiscal year, a document obtained by Reuters showed, underscoring the huge burden created by the government’s borrowings. The amount to be allocated for debt-servicing for the year that will begin on April 1 is nearly as large as the gross domestic product of Singapore, which the World Bank put at $275 billion at the end of 2012. Japan’s Ministry of Finance (MOF), charged with drafting the state budget and issuing government bonds, will request 25.3 trillion yen (equivalent to $257 billion) in debt-servicing costs under the budget, the document showed on Tuesday. That will be up 13.7 percent from the amount set aside for the current fiscal year, reflecting the Ministry’s plan to guard against any future rise in long-term interest rates.
Japan’s History of Debt and Deficits
As Chart 2 shows, Japan’s outstanding gross government debt continues to grow rapidly. For example, in 1982, Japan’s government debt represented 44.7% of its GDP. However, by 2000 it had more than doubled to 106.8%. Today, Japan’s debt/GDP has almost doubled again to 210.0% of its GDP and total debt is ¥1 quadrillion.
 Since Japan never fully experienced the self-cleansing process of severe economic contraction immediately after 1989, its economy was unable to build a solid foundation to enable strong companies to grow; the up cycle never materialized.
Since Japan never fully experienced the self-cleansing process of severe economic contraction immediately after 1989, its economy was unable to build a solid foundation to enable strong companies to grow; the up cycle never materialized.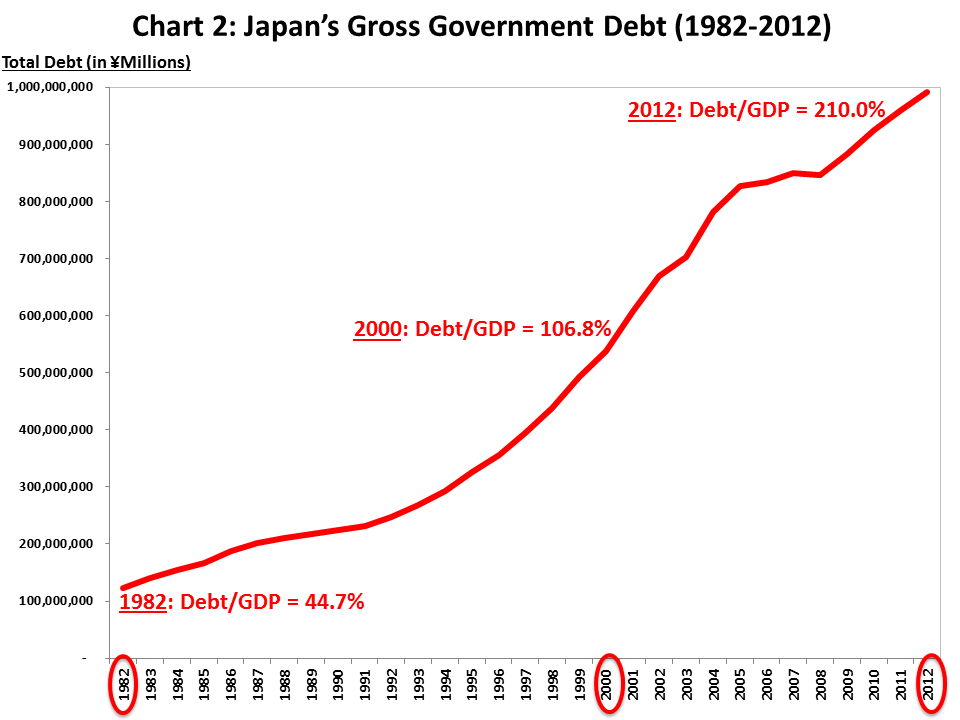
Japan’s astounding debt growth resulted from increasing annual deficits, which escalated after its 1989 real estate and stock market crash. Today, Japan’s annual deficit represents over 9% of its GDP (see Chart 12 below). Chart 3 shows the wide gap between Japan’s government revenue and expenses from 1965 to date. Government tax revenue (in Green) peaked in 1990 and continued to decline over the past 20+ years. Yet its expenses (in Red) continued to increase, as Japan’s government desperately tried to stimulate its economy.
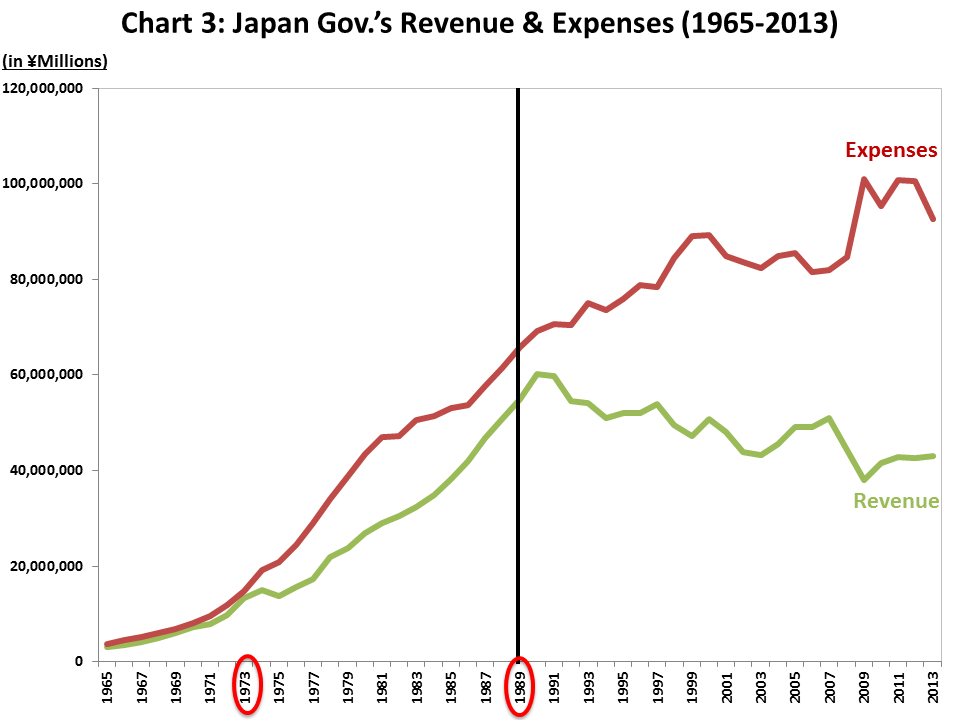
Today, Japan’s total annual expenses represent 186% of its annual tax revenue; it’s financing the 86% gap through borrowing. Spending 86% more than one collects during a period of economic stability does not promote confidence. Chart 3 highlights that the problem is one of revenue growth as Japan’s economy continues to falter. In desperation, Japan has now embarked on an even more dramatic plan to stimulate its moribund economy.
One has to wonder how Japan’s revenue, expenses and budget balances would have evolved post 1989, had they allowed weak companies, especially banks, to fail in the immediate aftermath of the crash. No doubt Japan would have had a severe and painful economic contraction, but it would likely have forced companies to restructure to better compete going forward. However, Japan sought not to address the excesses built up during the 1980s, nor to allow its weak companies to fail. Since Japan never fully experienced the self-cleansing process of severe economic contraction immediately after 1989, its economy was unable to build a solid foundation to enable strong companies to grow; the up cycle never materialized. Perhaps Japan’s fiscal and monetary intervention in the economy post 1989 actually caused more economic problems than it solved.
Have Japan’s Stimulus Programs Worked?
Over the past two decades, Japan embarked on numerous stimulus programs in an effort to kick-start its weak economy, with dismal results.14 The Chartered Financial Analyst’s 2012 article “The Japanese Debt Crisis (Part 2)”15 reviews Japan’s successive debt financings and economic challenges since 1989, which explains why Japan has limited options today. Thus, when current Prime Minister Shinzō Abe was elected in December 2012, he decided to take drastic action to stimulate Japan’s economy. Abe’s three-arrow approach (dubbed Abenomics16) focuses on aggressive monetary easing by the Bank of Japan (BOJ) (Arrow 1 – printing Yen), massive fiscal stimulus (Arrow 2 – running operating deficits) and structural reforms to boost Japan’s competitiveness (Arrow 3 – opening up its closed economy).
Today, the BOJ’s quantitative easing (QE)17 program (Arrow 1) involves buying ¥7 trillion of bonds monthly. Abe hopes to ignite Japan’s economy by doubling the Yen in circulation over two years. He is mimicking the Fed’s current QE program, but on a much grander scale. (Japan’s stimulus relative to the size of its economy is the equivalent of the Fed buying $200 billion of bonds monthly, or $2.4 trillion annually). Abe’s “shock-and-awe” program appears to be a desperate move by a country that has run out of traditional options.
If the current effective interest rate doubles to 2.4% and its debt continues to grow, one can easily see Japan spending 50+% of its tax revenue to service debt.
If the current effective interest rate doubles to 2.4% and its debt continues to grow, one can easily see Japan spending 50+% of its tax revenue to service debt.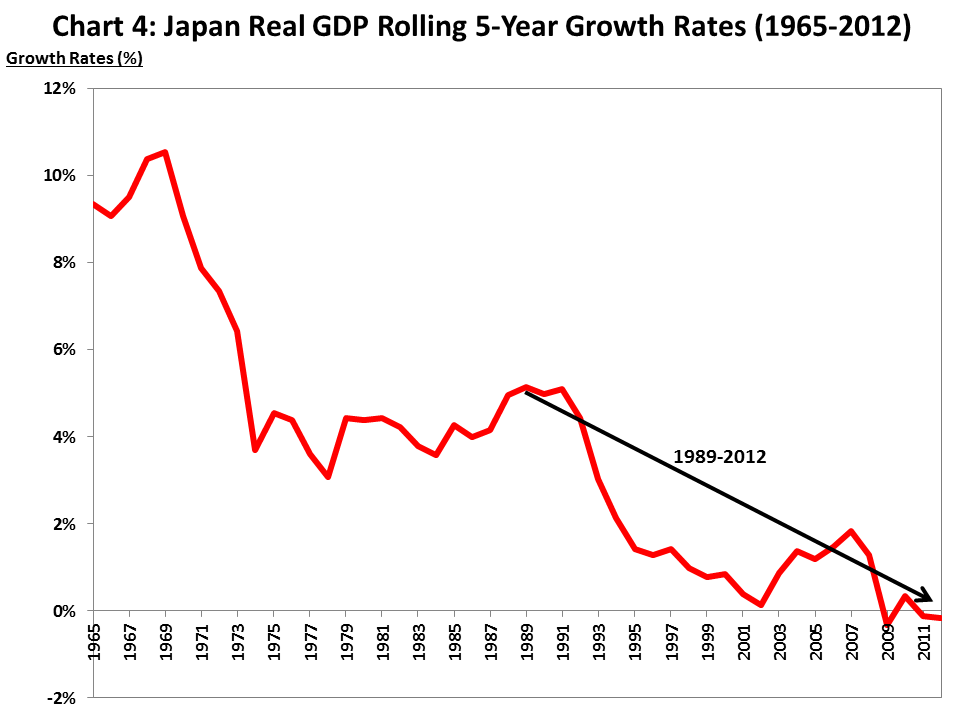
Managing the Mountain of Debt
Today, we bear witness to Japan’s economic decline, and its future looks bleak. The debt burden has become a huge cost for the Japanese, with little or no benefit.
Today, we bear witness to Japan’s economic decline, and its future looks bleak. The debt burden has become a huge cost for the Japanese, with little or no benefit.To date, Japan has financed more than 90% of its debt internally by borrowing from its own population, local insurance companies and large pension plans.19 But the demographics are evolving and pension plans are becoming net sellers of bonds, as they start to pay income to a growing number of retirees. Thus, over time, Japan may have difficulty financing its debt domestically, and its bond yields will need to be attractive to global investors. Further, Japan’s average debt maturity today is around six years, and 60% of its debt must be refinanced in the next five years. This refinancing may expose Japan to the global capital markets at a vulnerable moment.20
Today, we bear witness to Japan’s economic decline, and its future looks bleak. The debt burden has become a huge cost for the Japanese, with little or no benefit. At some point, investors may refuse to refinance Japan at cheap rates, and problems can quickly escalate.21 While it’s hard to know what will trigger a debt crisis in Japan, the potential domino effects may be very challenging for all heavily indebted economies, including the U.S. Before we discuss the U.S. debt situation and some striking parallels to Japan, we first review Japan’s equity market over the lost decades.
Whither Japan’s Equity Market?
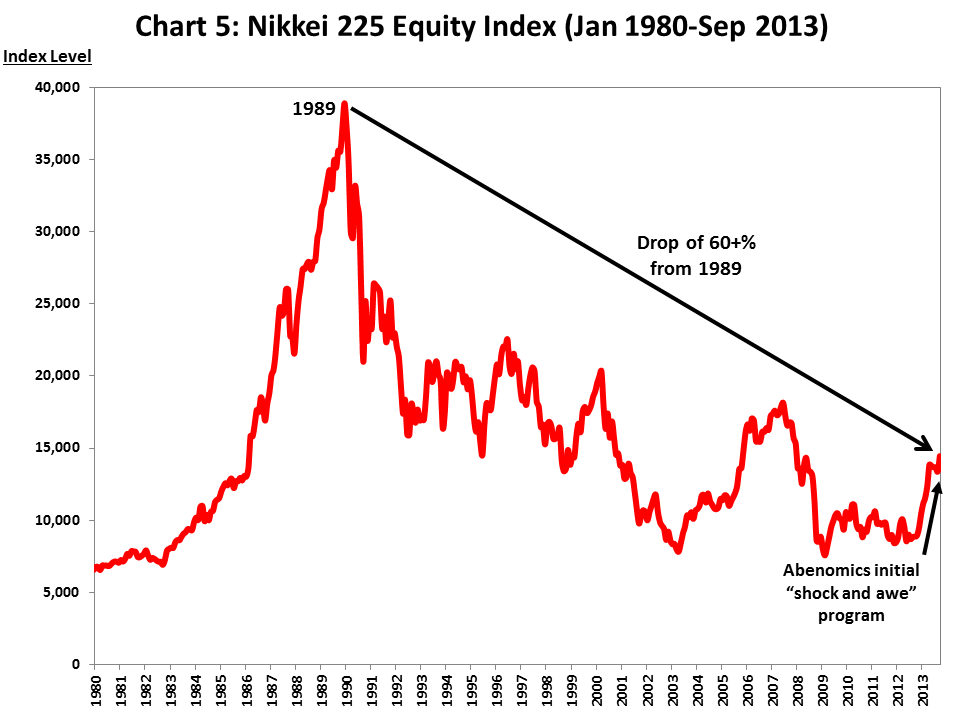
Since the bursting of Japan’s 1989 real estate and stock market bubble, Japan’s equity market performance has been dismal, and it’s difficult to make a strong case today to buy Japanese equities. Chart 5 shows the Nikkei 225 Equity Index (Nikkei) for Japan’s top 225 companies from 1980 to date. While the initial effects of Abenomics22 have been positive for Japanese equities – the Nikkei rose from 9,000 in Sep 2012 to 14,500 by Sep 2013 – the Nikkei is still down more than 60% from its peak of 39,000 in 1989.
Investors in Japan have suffered as equities imploded; there are few growth opportunities to lead the stock market higher. To date, Japan’s government has been unable, or unwilling to implement the necessary fiscal and structural reforms, and therefore it’s been difficult for the economy to renew and rebuild.
Turning to the U.S., we will see that the U.S. government’s mounting debt load and ongoing deficits since 2000 look eerily similar to what happened in Japan post 1989.
Page: